March 2024 Update: Who You Gonna Believe, Me or Your Lying Eyes?
February 2024 Market Recap
- US economic growth remains above trend.
- Inflation is also above the Fed’s 2% target but continues to decline at a reasonable rate.
- Japan slipped into recession, whereas Europe continues to narrowly avoid one.
- Treasury rates continue to drift higher as speculation mounts that the Fed will not cut interest rates as soon or as quickly as market participants expected at the beginning of the year.
- The Bloomberg Aggregate Bond Index and the Bloomberg Municipal Bond Index are slightly down for the year.
- Equity markets continue to perform well. The global stock market is up nearly 5% year-to-date.
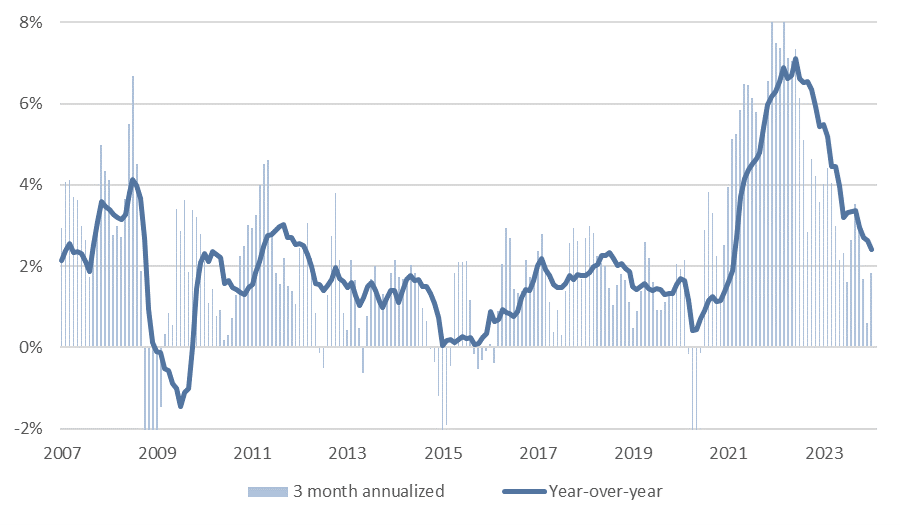
Who You Gonna Believe, Me or Your Lying Eyes? [1]Based on objective measures, the US economy is in a very good place. Growth remains intact (Fig. 1), and inflation has come down quickly (Fig. 2). As we discussed in our Year Ahead Livestream, monetary policy remains restrictive, and the Federal Reserve is closer to a rate cut than a hike, but whether Powell shouts “Now” to rate cuts in May or September might not matter much. The magnitude of cuts, versus the timing of cuts, is becoming a more pressing issue. The Fed currently tells us that 2.5% is the neutral rate for Fed policy, which means they think they can reduce the Fed Funds target from 5.25-5.5% all the way to 2.5% without stimulating growth or inflation. The market is telling us something very different. Should we believe the Fed or our lying eyes? The Fed hasn’t always believed that 2.5% represents the non-restrictive, non-accommodative, neutral Fed Funds rate. The neutral Fed Funds rate changes as structural economic conditions evolve, and the Fed moved their estimate of the neutral Fed Funds rate down from 4.3% to 2.5% between 2012 and 2019. In our opinion, market participants’ expectation for the yield on the 5-year Treasury note, five years from today, represents a reasonable market-based forecast for the neutral Fed Funds rate. It is currently at 4.25% (Fig. 3). You can see in Fig. 3 that the Fed tends to lag the market in resetting its forecast for “neutral.” Yes, the Fed can cut short-term rates without restoking inflation, but not by a lot. It doesn’t appear as though they have as far to go to get back to neutral as they currently claim.
[1] I’ve been told that some of my references are too outdated and/or esoteric for some of our readers. “Your lying eyes” harkens back to the Marx Brothers (Groucho, not Karl) movie Duck Soup. It refers to a situation where someone is obviously lying to you but also telling you to believe them instead of what you see. Richard Pryor also used the line in his first stand-up comedy special. |
Fig 1: Real GDP Growth is currently above the 2010-2019 trend
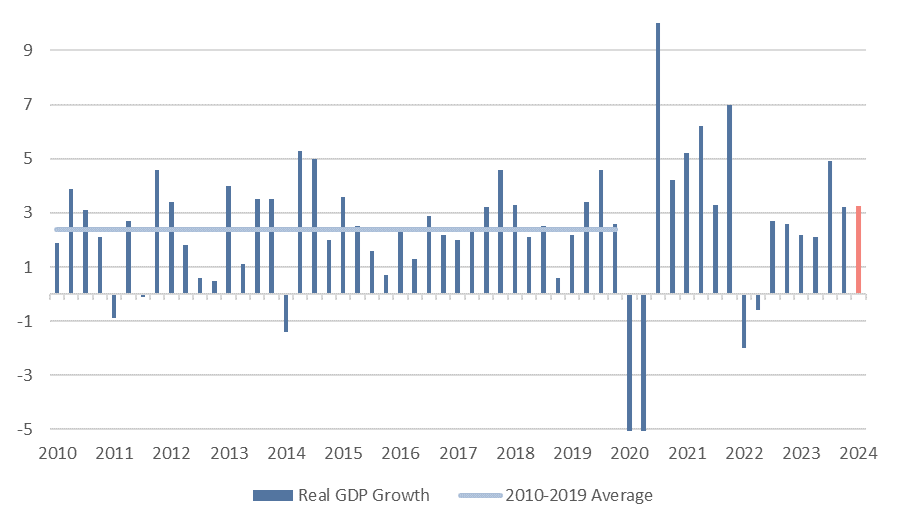
Fig 2: Inflation continues to decline
If the economy is so good, why aren’t consumers happy?
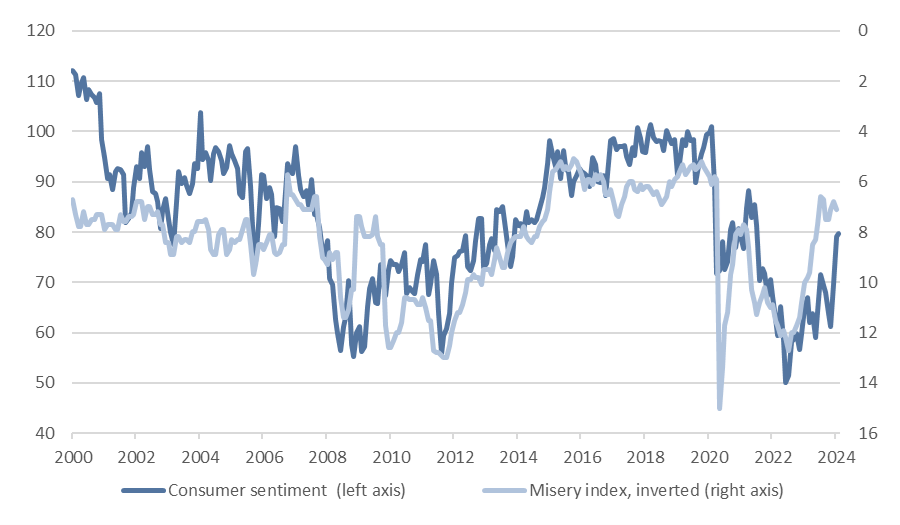
The always-opinionated former US Treasury Secretary and current Harvard Professor Larry Summers coauthored a paper in February titled “The cost of money is part of the cost of living: new evidence on the consumer sentiment anomaly.” Despite a good labor market and falling inflation, consumer sentiment has remained below what would be expected in the current economic environment. Should we believe the inflation and employment data or consumers’ lying eyes?
Summers et al finds that low sentiment is due to including higher borrowing costs in inflation statistics and shows in the paper that much of the “sentiment gap” can be explained once borrowing costs are included — another win for trusting our lying eyes.
One way to visualize the sentiment gap is to plot the so-called Misery Index, which adds together unemployment and inflation against sentiment (Fig. 4). On the bright side, the gap seems to be closing, but the other side of the coin is that sentiment and stock market returns tend to be negatively correlated (low sentiment leads to high returns).
Fig 3: The Fed is underestimating the "neutral" rate for today's economy
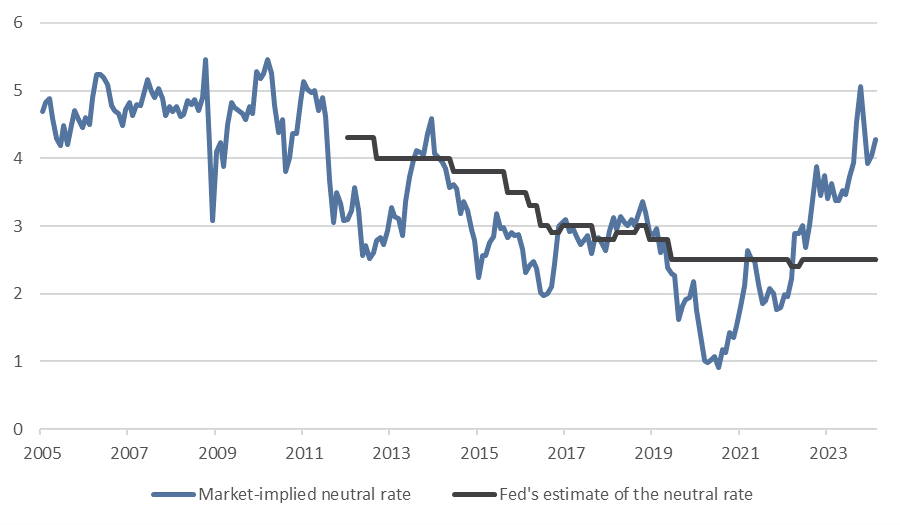
Fig 4: Consumers are less happy than economists think they should be
Headwinds are for bonds, tailwinds are for equities
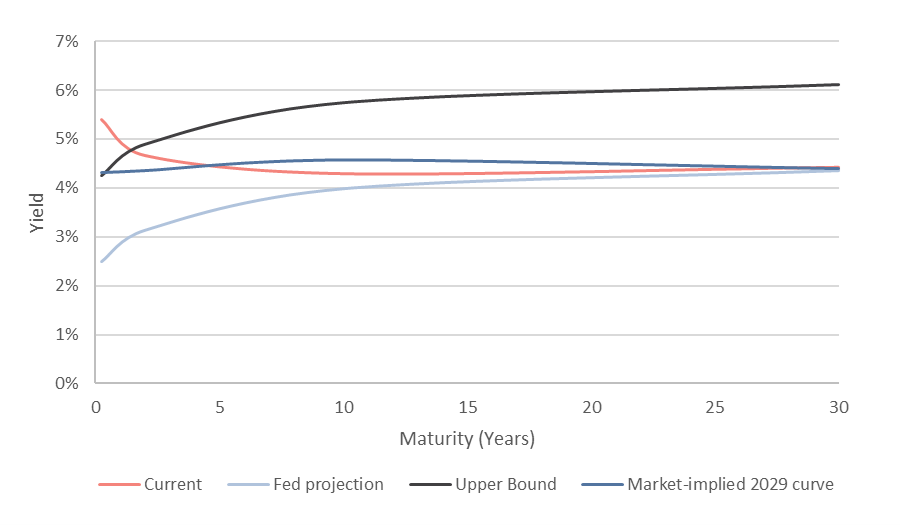
The 10-year Treasury is currently priced nearly perfectly at a 2.5% Fed funds rate (Fig. 5). If the Fed funds rate is at 2.5%, the 10-year Treasury should yield 4% based on the historical relationship between the two. The easiest way to see this is to picture the salmon line in Fig. 5 slowly migrating to the light blue line as the Fed cuts rates.
If the economy remains resilient and the Fed can only cut to 4.25%, what does that mean for the rest of the yield curve? When using historical data on the “normal” shape of the yield curve, a 4.25% Fed funds rate implies a 5.7% yield on the 10-year Treasury. We’ve labeled that line “upper bound.” What does the market expect? That’s the darker blue line. The Fed cuts to 4.25%, and the 10-year Treasury gravitates upwards to 4.6%. Either way, our lying eyes are telling us that there’s still a headwind for bonds, even if the Fed’s forecasts won’t admit it (yet). Our asset allocation targets, which we use as a starting point for customization, are underweight bonds in favor of low duration, high quality private debt.
Unlike bonds, equities have a tailwind – particularly in the US (we’re overweight US equities in a globally diversified equity portfolio). The factors driving above-trend economic growth will also support corporate profit growth. In our opinion, US equity valuations remain at the higher end of reasonable based on current interest rates, but the positives (above-trend income growth, accelerating capital expenditure spending for AI and digital infrastructure, swelled household balance sheets for baby boomers, prime household formation years for millennials, etc.) outweigh the negatives. Even so, we see no reason to try to time equity markets. All-time-highs are usually great times to invest; historically, they are no more likely to lead to a meaningful pull back than investing at any other time.
Fig. 5: Long yields could move higher as the Fed cuts the cash
Google & AI & Gemini, oh my! [2]
We wrote about artificial intelligence last week, so we won’t reiterate those thoughts here, but it’s worth noting the disastrous launch of Google’s rebranded AI, now called Gemini. Users quickly reported fairly odd results – For example, Gemini was uncertain as to whether Hitler or Elon Musk had caused more harm to humanity, it proclaimed that determining whether pedophilia is wrong required a nuanced answer and turned out to be incapable of drawing white people even in the appropriate historical context (e.g., Gemini decided medieval knights were Asian women, Nazis were black, etc.). There are dozens of more examples in a similar vein that you can find online. Overall, it’s a reminder that there will be winners and losers along the AI path, that human influence (politics, regulation, etc.) will be heavily embedded in AI models, and that large, successful firms can somehow completely mess up their most important projects without anyone realizing it. For his part, Google CEO Sundar Pichai called the issues “completely unacceptable, and we got it wrong.” Alphabet’s (Google’s parent company) share prices declined 7% since Gemini’s update on February 15th, versus an increase of 1.5% for the S&P 500 over the same period.
A very different AI story comes from the Swedish online shopping firm Klarna. Klarna integrated AI-powered customer assistance (AI handled the customers instead of human agents) and reported that it handled 2.3 million customer conversations in 35 languages, did the work of 700 full-time agents, was more accurate in error resolution than human agents, received similar customer satisfaction scores as human agents, resolved inquiries more quickly than humans, and will drive a $40mn profit improvement for Klarna in 2024. That’s the potential of AI.
[2] This is a reference to “Lions & Tigers & Bears, oh my!” from The Wizard of Oz.
Download Document
Download NowDisclosures & Important Information
Any views expressed above represent the opinions of Mill Creek Capital Advisers ("MCCA") and are not intended as a forecast or guarantee of future results. This information is for educational purposes only. It is not intended to provide, and should not be relied upon for, particular investment advice. This publication has been prepared by MCCA. The publication is provided for information purposes only. The information contained in this publication has been obtained from sources that
MCCA believes to be reliable, but MCCA does not represent or warrant that it is accurate or complete. The views in this publication are those of MCCA and are subject to change, and MCCA has no obligation to update its opinions or the information in this publication. While MCCA has obtained information believed to be reliable, MCCA, nor any of their respective officers, partners, or employees accepts any liability whatsoever for any direct or consequential loss arising from any use of this publication or its contents.
© 2025 All rights reserved. Trademarks “Mill Creek,” “Mill Creek Capital” and “Mill Creek Capital Advisors” are the exclusive property of Mill Creek Capital Advisors, LLC, are registered in the U.S. Patent and Trademark Office, and may not be used without written permission.