February 2025 Update: Concentration Risk in the US Stock Market
February 2025 Update: Concentration Risk in the US Stock Market
Last week’s tech sell-off focused financial media on an issue we’ve flagged since 2021: concentration risk in the US stock market, which has become dominated by a few behemoths.
This month, we examine US stock market concentration, but we want to emphasize upfront that most investors remain well-diversified in their overall public equity exposure. We currently advise investors to hold globally-diversified stock portfolios that are biased toward the US and have exposure to large, mid, and small cap stocks. A portfolio constructed in such a manner retains a pro-growth bias but doesn’t have the same concentration risk as a portfolio of only US large cap stocks (Fig. 1).
Fig. 1: Equity index weighting toward largest positions
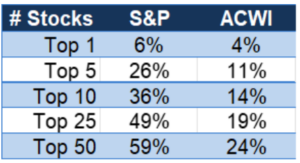
Source: Bloomberg, Mill Creek. As of 1/30/2025.
How concentrated is the US market?
The US equity market, as proxied by the S&P 500, is more top-heavy than it has been in the last 30 years (Fig. 1). The top 5 and 10 companies now comprise 26% and 36% of the overall market, respectively. Twenty-seven companies, or 5.4% of the number of companies in the index, comprise 50% of the exposure in the S&P 500.
Concentration is a double-edged sword. The largest companies in the S&P 500 have also been the best performers, and virtually any attempt to reduce exposure to the largest positions in the S&P detracted from recent performance (Fig. 2). On the other hand, most diversified investors don’t want an announcement about an artificial intelligence start-up in China to have an appreciable negative impact on their overall portfolio.
The technical term for what we are talking about is idiosyncratic risk. A diversified stock portfolio should mitigate nearly all company-specific (i.e. idiosyncratic) risks while providing exposure to the overall market. It’s hard to make a clear case that the S&P 500 is satisfying that objective at the current time since significant declines in a handful of stocks, like we experienced in 2022, can send the entire US market into a correction.
Fig. 2: S&P 500 concentration
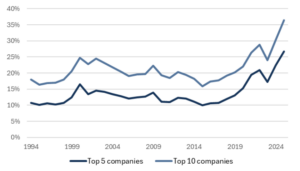
Source: Bloomberg, Mill Creek.
Fig. 3: Reducing concentration in the S&P has been a drag on returns

Source: Bloomberg, Mill Creek.
Winners win (until they don’t)
It is poorly understood by many investors that a limited number of companies always drive the bulk of equity market returns. There has never been a month, year, or decade where each company in the S&P 500 provided 1/500th of the overall return. It’s not even the case that 250 companies generally outperform the S&P 500 and 250 companies underperform the S&P 500. Most companies return less than Treasury bonds1 over their lifetimes and missing the winners in a portfolio is much worse for returns than avoiding a few losers.
If we examine US companies with more than 20 years of return data since 1925, NVIDIA, Netflix, Amazon, and Microsoft rank 1st, 3rd, 4th, and 16th in highest annualized return out of 5,139 total publicly traded firms2 over that period. We’ve recently lived through a period where an unusual number of US-based firms simultaneously produced historically high returns for their shareholders. Will it continue?
The Fama-French 3 Factor Model is as close to investment orthodoxy as one can get. In 1992, Eugene Fama (now a Nobel laureate) and Kenneth French published “Common risk factors in the returns on stocks and bonds,” which found persistent outperformance of small companies versus large companies and value companies versus growth companies. Many equity portfolio managers (long-short and long-only) have expected, and some continue to expect, a “value-premium” and a “small-cap premium.” Unfortunately, that expectation hasn’t worked out for them in a long time.
Small cap stocks have underperformed large cap stocks by an annualized -8.9% and -4.4% over the last 10 and 20 years, respectively.3 Value stocks have underperformed growth stocks by an annualized -8.6% and -5.4% over the last 10 and 20 years, respectively3. To quote Mark Twain, “It ain’t what you don’t know that gets you into trouble. It’s what you know for sure that just ain’t so.”
Which brings us to the recent geographic trend of US outperformance, US equities have outperformed international equities by 8.5% per year since 2007, a run that is reminiscent in duration and magnitude of outperformance in international equities between 1972 and 1988 (Fig. 4). We currently hold an overweight to US equities in our target portfolios, but, as history shows, there’s no guarantee that US outperformance will persist forever.
1Bessembinder, Hendrik (Hank), Do Stocks Outperform Treasury Bills? (May 28, 2018). Journal of Financial Economics (JFE), Forthcoming, Available at SSRN: https://ssrn.com/abstract=2900447
2Bessembinder, Hendrik (Hank), Which U.S. Stocks Generated the Highest Long-Term Returns? (July 16, 2024). Available at SSRN: https://ssrn.com/abstract=4897069
3https://pages.stern.nyu.edu/~adamodar/
Fig. 4: International and US stock market outperformance regimes
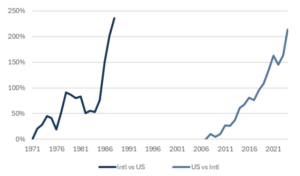
Source: Bloomberg, Mill Creek.
Finding balance
We’re only one month into 2025, and we’ve already talked to various investors who want to sell all of their US equities, only invest in US equities, sell all of their international equities, sell all of their US tech, or only invest in US tech. These are extreme reactions.
The outperformance of large, US technology-related firms has been remarkably persistent for a decade or longer and shouldn’t be viewed as a temporary phenomenon. We want to maintain adequate exposure to those firms. At the same time, adequate exposure isn’t synonymous with concentrated exposure. History teaches us that long-standing trends in the stock market can and do eventually end – sometimes violently. We believe a diversified portfolio of public and private global equities, biased toward the US, provides the right balance at this juncture.
Disclosures & Important Information
Any views expressed above represent the opinions of Mill Creek Capital Advisers ("MCCA") and are not intended as a forecast or guarantee of future results. This information is for educational purposes only. It is not intended to provide, and should not be relied upon for, particular investment advice. This publication has been prepared by MCCA. The publication is provided for information purposes only. The information contained in this publication has been obtained from sources that
MCCA believes to be reliable, but MCCA does not represent or warrant that it is accurate or complete. The views in this publication are those of MCCA and are subject to change, and MCCA has no obligation to update its opinions or the information in this publication. While MCCA has obtained information believed to be reliable, MCCA, nor any of their respective officers, partners, or employees accepts any liability whatsoever for any direct or consequential loss arising from any use of this publication or its contents.
© 2025 All rights reserved. Trademarks “Mill Creek,” “Mill Creek Capital” and “Mill Creek Capital Advisors” are the exclusive property of Mill Creek Capital Advisors, LLC, are registered in the U.S. Patent and Trademark Office, and may not be used without written permission.