Equity Market Concentration
Equity Market Concentration
Equity market performance has been less concentrated this year (but not in US large cap)
- Global equity market performance has been less concentrated in 2025 than it was in 2024 (Fig. 1). For example, 10 companies were responsible for 50% of index performance in 2024 versus 37% of index performance thus far in 2025.
- For US large cap, 2025 performance concentration has been similar to 2024, with five companies driving nearly 50% of index returns (Fig. 2).
- A higher percentage of global equities are positive this year (71%) than last year (54.7%), but the opposite is true in the US (64% this year vs. 67% for 2024).
- Longer term, only 47% of global equities and 57% of US large cap equities outperformed cash over decade ending July 31, 2025. Additionally, only seven of the top performance contributors for 2005-2015 remained in the top 15 over the last decade (Fig. 3).
Why it matters for investors
After a period of very narrow leadership in global equities, the broadening out of equity market performance is a welcome development for investors. However, the broadening has mainly happened outside of the US. US equity performance continues to be concentrated in the usual tech and growth suspects, and small cap US stocks have underperformed year-to-date.
Over the long term many stocks don’t outperform cash. Leadership also evolves – only seven of the top index 15 performance contributors between 2005 and 2015 remained in the top 15 over the last decade. These are challenges for active management and reasons we believe low cost, broad-based, index exposure should form the core of equity portfolios.
Fig. 1: Percentage of index performance coming from top performers (Global)
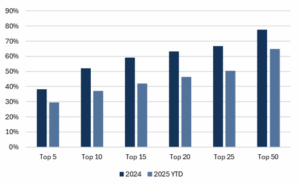
Source: Bloomberg, Mill Creek as of 8/19/2025.
Fig. 2: Percentage of index performance coming from top performers (US large cap)
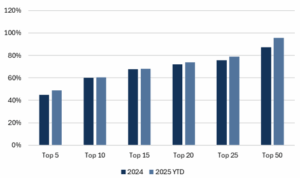
Source: Bloomberg, Mill Creek as of 8/19/2025.
Fig. 3: Top 15 index performance contributors
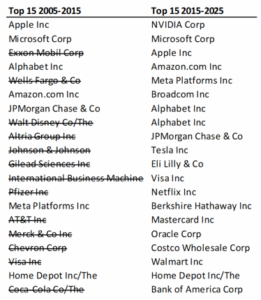
Source: Bloomberg, Mill Creek. Strikethrough used to indicate companies that fell out of the top 15. Data is for September 2005-August 2015 and September 2015-August 2025.
Disclosures & Important Information
Any views expressed above represent the opinions of Mill Creek Capital Advisers ("MCCA") and are not intended as a forecast or guarantee of future results. This information is for educational purposes only. It is not intended to provide, and should not be relied upon for, particular investment advice. This publication has been prepared by MCCA. The publication is provided for information purposes only. The information contained in this publication has been obtained from sources that
MCCA believes to be reliable, but MCCA does not represent or warrant that it is accurate or complete. The views in this publication are those of MCCA and are subject to change, and MCCA has no obligation to update its opinions or the information in this publication. While MCCA has obtained information believed to be reliable, MCCA, nor any of their respective officers, partners, or employees accepts any liability whatsoever for any direct or consequential loss arising from any use of this publication or its contents.
© 2025 All rights reserved. Trademarks “Mill Creek,” “Mill Creek Capital” and “Mill Creek Capital Advisors” are the exclusive property of Mill Creek Capital Advisors, LLC, are registered in the U.S. Patent and Trademark Office, and may not be used without written permission.