Four Charts that Explain Gold’s Rally
Four Charts that Explain Gold’s Rally
Despite decelerating inflation, gold has rallied about 40% over the last year and 22% annualized over the last 3 years.
- The relationship between real interest rates and the gold price broke down in 2022 (Fig. 1). Central bank purchases and a declining US dollar have been catalysts for higher prices since then.
- Central bank purchases of gold jumped in 2022 (Fig. 2) following the application of financial sanctions on Russia by the US Treasury. For those who missed it, our livestream with Edward Fishman, author of Chokepoints, included a discussion of financial sanction avoidance.
- Gold serves as a decent but not perfect hedge for a declining US dollar (Fig. 3).
- Gold has rallied against all major currencies as investors become increasingly concerned about the fiscal outlooks for developed economies (Fig. 4)
Why it matters for investors:
Gold prices have benefited from strong central bank demand and a loss of investor confidence in the fiscal sustainability of major economies. We expect those tailwinds to continue, but investors shouldn’t be surprised to see a near-term pullback or consolidation period following such a significant rally. Gold is historically expensive relative to oil and other commodities.
We’ve preferred to hedge dollar weakness through assets including international equities, farmland, and real estate, but would consider adding gold exposure following a pull back if (1) it appears as though the next Fed chair will push to lower the Fed funds rate below “neutral” and (2) see a significant FOMO (fear of missing out) trade building in retail gold flows. Retail investor gold flows were negative in 2022, 2023, and 2024, but turned positive in the first quarter of this year.
Fig. 1: Gold price and inflation-adjusted 10-year Treasury yield
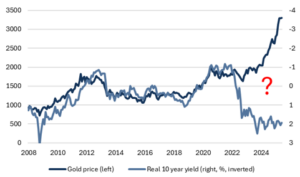
Source: Bloomberg, Mill Creek. 1/1/2008-06/30/2025.
Fig. 2: Central bank gold demand (Quarterly, metric tonnes)
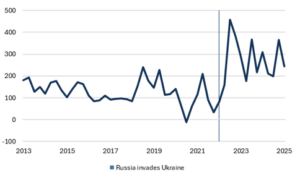
Source: Bloomberg, Mill Creek. 01/01/2013-03/31/2025.
Fig. 3: US dollar and gold price relationship
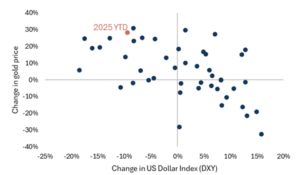
Source: Bloomberg, Mill Creek. 1980-2025 YTD. Calendar year returns.
Fig. 4: Gold price indexed to average of USD, GBP, CHF, JPY, and EUR.
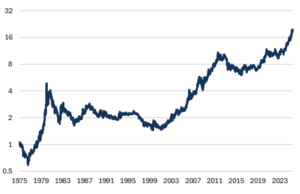
Source: Bloomberg, Mill Creek. 01/01/1975- 6/30/2025.
Disclosures & Important Information
Any views expressed above represent the opinions of Mill Creek Capital Advisers ("MCCA") and are not intended as a forecast or guarantee of future results. This information is for educational purposes only. It is not intended to provide, and should not be relied upon for, particular investment advice. This publication has been prepared by MCCA. The publication is provided for information purposes only. The information contained in this publication has been obtained from sources that
MCCA believes to be reliable, but MCCA does not represent or warrant that it is accurate or complete. The views in this publication are those of MCCA and are subject to change, and MCCA has no obligation to update its opinions or the information in this publication. While MCCA has obtained information believed to be reliable, MCCA, nor any of their respective officers, partners, or employees accepts any liability whatsoever for any direct or consequential loss arising from any use of this publication or its contents.
© 2025 All rights reserved. Trademarks “Mill Creek,” “Mill Creek Capital” and “Mill Creek Capital Advisors” are the exclusive property of Mill Creek Capital Advisors, LLC, are registered in the U.S. Patent and Trademark Office, and may not be used without written permission.