Late Cycle Markets With Early Cycle Policy in Six Charts
Late Cycle Markets With Early Cycle Policy in Six Charts
Investing, like economics, isn’t a hard science. While we use quantitative data to develop hypotheses about markets, the animal spirits of human nature make controlled experiments and exact predictions impractical.
That being said, the economy broadly follows an observable cycle, as do investment markets, which can be a helpful guide to investment decisions. Unfortunately, we’re currently in an unusual environment for investors: late-cycle economic and market characteristics with early-cycle fiscal and monetary policy.
These late-cycle economic and market characteristics include:
- Economic growth that is well-above trend for the US (Fig. 1),
- Inflation that remains stubbornly above target and might be creeping upward (Fig. 2),
- Low unemployment (Fig. 3), and
- Investor euphoria as revealed by stock allocations at all-time highs (Fig. 4).
Late cycle is also usually characterized by restrictive monetary and fiscal policy. The Fed would typically push back against inflation through higher policy rates, which also creates a headwind to investor euphoria. This cycle is different. The federal government is operating an early-cycle policy:
- We continue to run a 6% of GDP budget deficit, which is a stimulus level typically seen during a massive crisis (Fig. 5), and
- The Federal Reserve has embarked on a rate-cutting cycle, which typically happens after growth has slowed considerably or during a recession (Fig. 6).
As we said last week, these are complicated times for investors, but it is too early to call the top. Risks worth watching include higher bond yields, a hawkish Fed, and concrete messaging from the Magnificent Seven that AI revenue targets will not be achieved. Until then, we remain comfortable with a modest pro-growth tilt in portfolios.
Fig. 1: US GDP Growth (%)
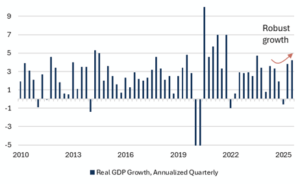
Source: Bloomberg, Mill Creek. As of 11/30/2025
Fig. 2: US Inflation (Consumer Price Index)
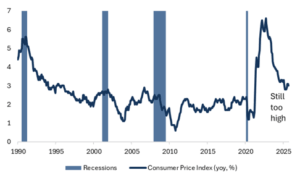
Source: Bloomberg, Mill Creek. As of 11/30/2025
Fig. 3: US Unemployment Rate
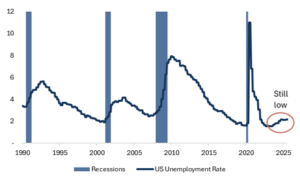
Source: Bloomberg, Mill Creek. As of 11/30/2025
Fig. 4: Average Investor Equity Allocation (% of financial assets)
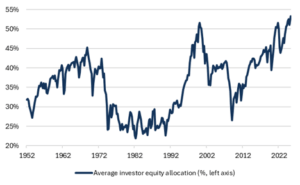
Source: FRED, Mill Creek. As of 11/30/2025
Fig. 5: US budget deficit as percentage of GDP
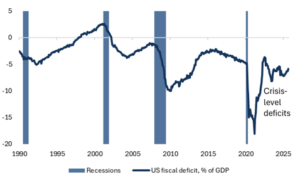
Source: Bloomberg, Mill Creek. As of 11/30/2025
Fig. 6: Fed funds rate
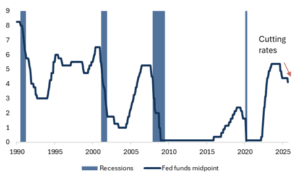
Source: Bloomberg, Mill Creek. As of 11/30/2025
Disclosures & Important Information
Any views expressed above represent the opinions of Mill Creek Capital Advisers ("MCCA") and are not intended as a forecast or guarantee of future results. This information is for educational purposes only. It is not intended to provide, and should not be relied upon for, particular investment advice. This publication has been prepared by MCCA. The publication is provided for information purposes only. The information contained in this publication has been obtained from sources that
MCCA believes to be reliable, but MCCA does not represent or warrant that it is accurate or complete. The views in this publication are those of MCCA and are subject to change, and MCCA has no obligation to update its opinions or the information in this publication. While MCCA has obtained information believed to be reliable, MCCA, nor any of their respective officers, partners, or employees accepts any liability whatsoever for any direct or consequential loss arising from any use of this publication or its contents.
© 2025 All rights reserved. Trademarks “Mill Creek,” “Mill Creek Capital” and “Mill Creek Capital Advisors” are the exclusive property of Mill Creek Capital Advisors, LLC, are registered in the U.S. Patent and Trademark Office, and may not be used without written permission.