P/E-king into the Future of Stock Returns
P/E-king into the Future of Stock Returns
Equity markets have been volatile since April 2nd (i.e. Liberation Day). Over the 16 trading days following the April 2nd tariff announcement, 50% of the days experienced gains or losses of more than 2%, which is on par with the volatility see during the popping of the dot-com bubble (2002), the global financial crisis (2008), Eurozone crisis (2011), the COVID decline (2020), and the inflation/interest rate turmoil of 2022.
From a performance standpoint, extreme moves have occurred on both the positive and negative sides of the ledger. The initial steep decline took 14% off US equity values, but prices have since recovered those losses (Fig. 1). US equities are now back to their Liberation Day levels and the MSCI All Country World Index produced a positive return over the course of April.
Fig. 1: S&P 500 Index, April 1 – April 30, 2025.
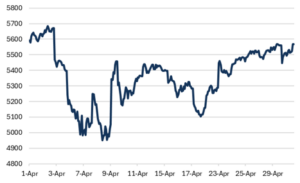
Source: Bloomberg, Mill Creek.
Potential scenarios
While it is way too early to proclaim an end to the tariff storm, the stock market recovery presents a good opportunity to look at potential outcomes for US equity markets over the next year. In this article, we examine three different possible outcomes: (1) Optimistic, (2) Base case, and (4) Pessimistic.
The base case scenario, in our opinion, is one where President Trump is able to successfully make progress on a few major trade deals, deescalate with China, pass reconciliation, and accomplish some deregulation. This list might sound optimistic after the chaos of the last few weeks, but it’s a lower bar than what many market participants were pricing in at the beginning of the year.
In our opinion, an optimistic scenario requires all of the base case items along with something more substantial to revitalize animal spirits – a major trade deal with China and an end to the Russia/Ukraine war would be potential catalysts. The pessimistic scenario is easier to imagine at the current juncture since it would be a continuation of what we experienced in early April – an ongoing and escalating tariff conflict that pushes the US, and other major economies, into recession.
Quantifying the outcomes
An analysis of stock market earnings and valuations can help us quantify potential outcomes in each scenario. The important metrics for this analysis are expected earnings growth and the P/E ratio.
We generally focus on consensus earnings growth for the next 12 months, as that metric provides an indication of what equity analysts expect in the coming year. Earnings generally grow during economic expansions and contract during recessions (Fig. 2). Incorporating all expansions and contractions, S&P earnings growth has averaged 8% per year since 1990.
Fig. 2: 12-month forward S&P 500 earnings per share
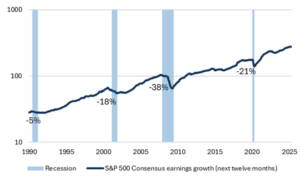
Source: Bloomberg, Mill Creek.
P/E represents the valuation of the index, or price/earnings. It is simply a measure of how much investors are willing to pay for a dollar of earnings. Investors are generally willing to pay a higher P/E for stocks when the economy is expanding and markets are calm, but require a lower P/E ratio during periods of market turmoil or recession.
As of April 30, 2025, the 12-month forward earnings expectation for the S&P 500 is $275 per share and the index price is 5569. If we take the price (5569) and divide it by expected earnings ($275), we get the P/E ratio, which is currently 20.3.
Our scenarios are therefore constructed as follows[1]:
- The optimistic outcome assumes 10-15% EPS growth (equal to the long-term trend during expansions) and that the P/E ratio settles between 20 and 22 (a range generally associated with a risk-on environment).
- The base case outcome assumes expected earnings growth slows to 0-10% and the S&P maintains a 20 P/E ratio.
- The pessimistic outcome assumes a -15-20% hit to earnings and a 16-18 P/E ratio.
These assumptions reflect historical averages for similar events.
The base case scenario results in modest equity returns, the optimistic scenario implies 15-25% returns, and the pessimistic scenario results in a bear market (Fig. 3). Elevated policy uncertainty gives us pause in regard to trying to place specific probabilities around these outcomes, but we believe the base case scenario is the modal outcome at this point. However you slice it, is fair to conclude that the math doesn’t add up to exceptional US equity returns as long as tariff uncertainty presents a headwind to corporate earnings and animal spirits.
[1] For those questioning why these numbers differ from our capital market assumptions (CMAs), our CMAs are estimated returns over a full market cycle instead of the hypothetical range of outcomes we’re focused on here.
Fig. 3: S&P returns based on various EPS and P/E assumptions
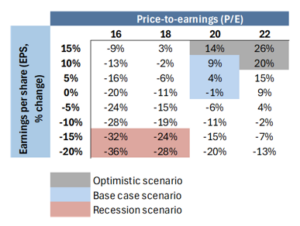
Source: Bloomberg, Mill Creek.
Disclosures & Important Information
Any views expressed above represent the opinions of Mill Creek Capital Advisers ("MCCA") and are not intended as a forecast or guarantee of future results. This information is for educational purposes only. It is not intended to provide, and should not be relied upon for, particular investment advice. This publication has been prepared by MCCA. The publication is provided for information purposes only. The information contained in this publication has been obtained from sources that
MCCA believes to be reliable, but MCCA does not represent or warrant that it is accurate or complete. The views in this publication are those of MCCA and are subject to change, and MCCA has no obligation to update its opinions or the information in this publication. While MCCA has obtained information believed to be reliable, MCCA, nor any of their respective officers, partners, or employees accepts any liability whatsoever for any direct or consequential loss arising from any use of this publication or its contents.
© 2025 All rights reserved. Trademarks “Mill Creek,” “Mill Creek Capital” and “Mill Creek Capital Advisors” are the exclusive property of Mill Creek Capital Advisors, LLC, are registered in the U.S. Patent and Trademark Office, and may not be used without written permission.