Tariffs and Earnings Season, So Far…
Tariffs and Earnings Season, So Far…
The trade saga has continued to develop at a rapid pace. Since President Trump’s announcement of “reciprocal” tariffs on April 2, the White House has temporarily reduced tariff rates charged on goods from many countries and exempted certain goods from the levies entirely (including many tied to the smartphone and personal computer supply chains). At the same time, the trade conflict with China continues to escalate, with the US increasing tariffs on Chinese imports to 145% (from an initial rate of 67%), and China in turn placing tariffs of 125% on US goods.
The net impact of these developments is that the estimated effective tariff rate to the US consumer has risen relative to the original April 2 announcement (Fig. 1). How the dispute between the world’s two largest economies evolves over the coming weeks will be crucial in determining its impact on the global economy and capital markets.
Fig. 1: Estimated US Average Effective Tariff Rate
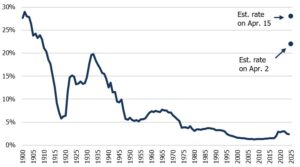
Source: The Budget Lab at Yale, Mill Creek.
Unsurprisingly, the volatility around trade policy has begun to make its way into corporate communications to shareholders with earnings season underway. Recently, chipmakers Nvidia and AMD announced that they expect to incur charges of $5.5 billion and $800 million, respectively, due to the trade conflict and corresponding export controls to China. Other companies have begun withdrawing earnings guidance for this year during their quarterly announcements.
One silver lining is that corporations were on relatively stable footing heading into the month. Quarter-to-date, S&P 500 companies have reported solid – if unspectacular – earnings growth of roughly +6.8% YoY, slightly lower than the 20-year average of +7.8% (Fig. 2). This performance is expected to continue, with consensus estimates for Q1 EPS growth (per FactSet) currently sitting at +7.3%. However, should companies continue to pull their forward guidance over the coming weeks due to trade uncertainty, this is likely to dominate headlines and increase volatility moving forward.
Fig. 2: S&P 500 Annual EPS Growth
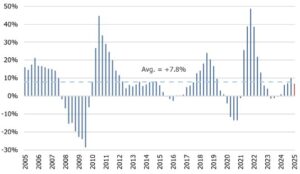
Source: Bloomberg, Mill Creek. As of 4/17/25.
Disclosures & Important Information
Any views expressed above represent the opinions of Mill Creek Capital Advisers ("MCCA") and are not intended as a forecast or guarantee of future results. This information is for educational purposes only. It is not intended to provide, and should not be relied upon for, particular investment advice. This publication has been prepared by MCCA. The publication is provided for information purposes only. The information contained in this publication has been obtained from sources that
MCCA believes to be reliable, but MCCA does not represent or warrant that it is accurate or complete. The views in this publication are those of MCCA and are subject to change, and MCCA has no obligation to update its opinions or the information in this publication. While MCCA has obtained information believed to be reliable, MCCA, nor any of their respective officers, partners, or employees accepts any liability whatsoever for any direct or consequential loss arising from any use of this publication or its contents.
© 2025 All rights reserved. Trademarks “Mill Creek,” “Mill Creek Capital” and “Mill Creek Capital Advisors” are the exclusive property of Mill Creek Capital Advisors, LLC, are registered in the U.S. Patent and Trademark Office, and may not be used without written permission.