Two Equity Scare Charts (and A Reason Not to Worry)
Two Equity Scare Charts (and A Reason Not to Worry)
- Equity valuations, regardless of how they are calculated, are at or near dot-com levels (Fig. 1).
- The average investor’s allocation to equities, which tends to be inversely correlated to future returns, has hit an all-time high (Fig. 2).
- Leverage within public equities remains low, and the “frothiest” part of the market, US growth equities, has the cleanest balance sheets.
Eye-wateringly high US equity valuations bode poorly for long term returns. The average investor’s equity allocation, which tends to be inversely correlated with long-term returns, has also reached an all-time high. These data points should give us all pause.
However, the news isn’t all bad: one reasonable justification for higher valuations is that corporate balance sheets remain deleveraged relative to the pre-GFC era. The frothiest parts of the US market, US growth companies and the hyperscalers in particular, have very little net debt on their balance sheets.
Valuations are very poor predictors of returns over periods of less than 7 years, but we won’t pretend gravity doesn’t exist. Absent an earnings boom (AI?), investors are looking at muted long-term US equity returns from this valuation starting point.
Shorter term, all-time-highs signal optimism and are usually good times to invest. Investors that need to put cash to work or are dollar cost averaging into the market should continue to do so, despite high valuations. Conversely, many investors are now overweight equities and hopefully figures 1 and 2 provide some motivation to consider rebalancing.
Fig. 1: S&P 500 valuation
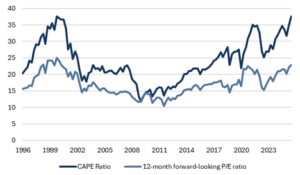
Source: Bloomberg, Mill Creek. Data as of 9/23/25.
Fig. 2: Average investor’s equity allocation and 10-year subsequent return
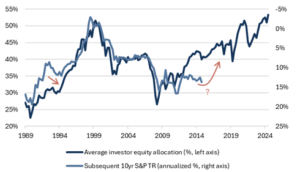
Source: Bloomberg, Mill Creek. Data as of 9/23/25. https://www.philosophicaleconomics.com/2013/12/the-single-greatest-predictor-of-future-stock-market-returns/
Fig. 3: Net debt / EBITDA (Annual)
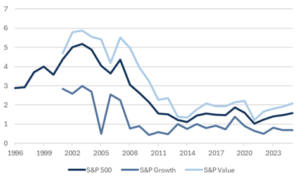
Source: Bloomberg, Mill Creek. Data as of 9/23/25.
Disclosures & Important Information
Any views expressed above represent the opinions of Mill Creek Capital Advisers ("MCCA") and are not intended as a forecast or guarantee of future results. This information is for educational purposes only. It is not intended to provide, and should not be relied upon for, particular investment advice. This publication has been prepared by MCCA. The publication is provided for information purposes only. The information contained in this publication has been obtained from sources that
MCCA believes to be reliable, but MCCA does not represent or warrant that it is accurate or complete. The views in this publication are those of MCCA and are subject to change, and MCCA has no obligation to update its opinions or the information in this publication. While MCCA has obtained information believed to be reliable, MCCA, nor any of their respective officers, partners, or employees accepts any liability whatsoever for any direct or consequential loss arising from any use of this publication or its contents.
© 2025 All rights reserved. Trademarks “Mill Creek,” “Mill Creek Capital” and “Mill Creek Capital Advisors” are the exclusive property of Mill Creek Capital Advisors, LLC, are registered in the U.S. Patent and Trademark Office, and may not be used without written permission.