Inflation or Employment? Four Charts About The Fed’s Rate Cut
Inflation or Employment? Four Charts About The Fed’s Rate Cut
The Federal Reserve’s Open Market Committee (FOMC) voted to cut the Fed funds rate by 0.25% last Wednesday, resuming a rate-cutting cycle that initially started 12 months ago. The initial cutting cycle started in September 2024 but was quickly paused after additional cuts in November and December. The Fed funds rate target was lowered from 5.25-5.5% to 4.25-4.5% during that period.
A quarter-point cut by the Fed was well-telegraphed and fully priced in by market participants. While inflation has yet to reach 2%, FOMC members are worried about the labor market. As we discussed last week, the abrupt closing of the southern border has resulted in perhaps 200k fewer migrants entering the labor force each month, which has made the jobs data difficult to interpret. For now, the Fed is biased toward stimulating growth at the risk of higher inflation.
As we’ve discussed, President Trump has been making a fiscal case for rate cuts. Fed Chair Jerome Powell used Jackson Hole to pivot to a (fragile, in our opinion) monetary case for rate cuts. Regardless of the reason, everyone with influence wants to cut policy rates, and more cuts are likely to come (Fig. 1).
- Inflation is higher, not lower, than when the Fed paused rate cuts at the beginning of the year (Fig. 2).
- Despite many cross-currents in the labor market (e.g. a sudden stop to immigration), the labor market remains very normal in regard to the unemployment rate and the job vacancy rate (Fig. 3).
- Real GDP continues to track above trend (Fig. 4).
What matters for investors:
- Lower short-term interest rates benefit industries that typically rely on short-term borrowing, like real estate construction and banking.
- Investors will see lower yields on short-term fixed income and certain private credit investments.
- Lower short term rates make the dollar less attractive versus other developed market currencies.
- All else equal, we believe a series of policy rate cuts adds fuel to the supportive environment for risk assets but also increases the risk of elevated inflation in the mid-term.
Fig. 1: Fed funds target rate (solid line) and market implied path (dashed line)
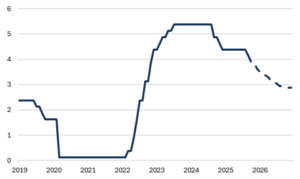
Source: Bloomberg, Mill Creek. 2019 – September 18, 2025.
Fig 2: Fed funds target and PCE inflation
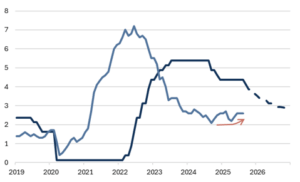
Source: Bloomberg, Mill Creek. 2019 – September 18, 2025.
Fig. 3: The Beveridge Curve indicates a normal labor market
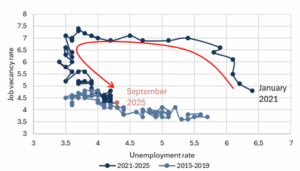
Source: Bloomberg, Mill Creek.
Fig. 4: Quarterly real GDP growth, 2023-Q3 2025 (annualized)
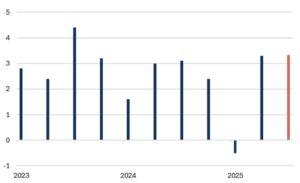
Source: Bloomberg, Mill Creek. Q3 2025 is the Atlanta Fed GDPNow estimate as of September 17.
Disclosures & Important Information
Any views expressed above represent the opinions of Mill Creek Capital Advisers ("MCCA") and are not intended as a forecast or guarantee of future results. This information is for educational purposes only. It is not intended to provide, and should not be relied upon for, particular investment advice. This publication has been prepared by MCCA. The publication is provided for information purposes only. The information contained in this publication has been obtained from sources that
MCCA believes to be reliable, but MCCA does not represent or warrant that it is accurate or complete. The views in this publication are those of MCCA and are subject to change, and MCCA has no obligation to update its opinions or the information in this publication. While MCCA has obtained information believed to be reliable, MCCA, nor any of their respective officers, partners, or employees accepts any liability whatsoever for any direct or consequential loss arising from any use of this publication or its contents.
© 2025 All rights reserved. Trademarks “Mill Creek,” “Mill Creek Capital” and “Mill Creek Capital Advisors” are the exclusive property of Mill Creek Capital Advisors, LLC, are registered in the U.S. Patent and Trademark Office, and may not be used without written permission.